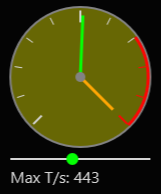
What the Speedometer does
When the market suddenly speeds up, you want to know right away, without staring at Time & Sales. The Speedometer is a live gauge on your chart with two needles on one dial:
- Green needle, ticks per second: how fast trades are printing on the tape.
- Orange needle, bars per minute: how many bars formed in the last 60 seconds.
The gauge face glows yellow as activity rises, and a red redline zone covers the top of the dial, so a busy tape is obvious from across the room.
It's a real-time tool: the needles move with incoming market data, so it needs a live feed, or a replay or simulated one. On a quiet or historical chart the needles rest near zero.
The two needles
Ticks per second (green)
Counts last-trade prints per second, averaged over the Ticks Window you set (5 seconds by default). Because it's driven by market data rather than bars, it works on any chart type. A shorter window makes the needle more responsive; a longer one smooths it out.
Bars per minute (orange)
Counts how many bars formed in the last 60 seconds. This is meaningful on activity-based charts, such as Renko, Range, Tick or Volume, where bars form as price moves or volume trades. On a time-based chart, such as 1-minute bars, bars form on a fixed clock, so this needle stays constant; rely on the green needle there.
Scaling the dial
Each needle has its own full-scale value, the reading that puts it at the far right of the dial. Set Max Ticks/sec near the fast end of what your instrument normally prints, and Max Bars/min for activity-based charts. With Show Slider on, a slider under the gauge changes Max Ticks/sec on the fly, without opening the settings.
Settings
| Setting | Default | What it does |
|---|---|---|
| Radius (px) | 80 | Size of the gauge (20–500 pixels). |
| Corner | TopLeft | Which chart corner the gauge anchors to. |
| Offset X / Y (px) | 15 / 15 | Margins from that corner. |
| Ticks Window (sec) | 5 | Averaging window for the green needle. The orange needle always uses 60 seconds. |
| Show Text | On | Shows the ticks/sec and bars/min readouts under the gauge. |
| Show Slider | On | Shows the slider that sets Max Ticks/sec. |
| Max Ticks/sec | 50 | Full-scale value for the green needle. |
| Max Bars/min | 60 | Full-scale value for the orange needle (activity-based charts only). |
| Max Slider Value | 1000 | The highest Max Ticks/sec the slider can set. |
| Ticks / Bars Needle Color | Green / Orange | Needle and readout colors. |
For strategy developers
Both rates are exposed as series you can read from your own NinjaScript strategies or indicators. They also appear in NinjaTrader's Data Box as TicksPerSecond and BarsPerMinute.
// class field
private TbSpeedometer speedo;

// in State.DataLoaded
speedo = TbSpeedometer(/* your params + license key */);

// in OnBarUpdate
double tps = speedo.TicksPerSecond[0];
double bpm = speedo.BarsPerMinute[0];
These are real-time rates: they read 0 on historical bars and start filling in once the chart is live. Set your strategy's Calculate to OnEachTick if you want them updated within a bar.
Tips for using it
- Calibrate to your instrument. Watch the green needle for a few active minutes, then set Max Ticks/sec so a fast burst reaches the redline. Liquid instruments need a much higher value than slow ones.
- On time charts, ignore the orange needle, or run the gauge on a Renko, Range, Tick or Volume chart where it becomes meaningful.
- Keep it out of the way. Use Corner, the offsets and Radius to tuck the gauge where it doesn't cover price.
Installation and activation
- Download the zip above. In NinjaTrader 8, go to Tools → Import → NinjaScript Add-On… and select the indicator's add-on zip. It compiles automatically. The PDF user guide in the download walks through every step.
- Add it to a chart: right-click the chart, choose Indicators… and pick TbSpeedometer.
- Order on Whop to receive your Whop license key.
- In NinjaTrader, open Help → About and copy your Machine ID.
- On the Activate page, enter your Whop license key and Machine ID to get your indicator key.
- Paste that key into the indicator's LicenseKey setting and click OK.
Each license covers up to 2 computers. If you reinstall NinjaTrader or switch computers, simply activate again. If you've reached the 2-computer limit, email support@tradebrary.com to free up a slot.
Frequently asked questions
Why don't the needles move?
The gauge needs live data. Check that the market is open (or that you're replaying or simulating data) and that your data feed is connected.
Why does the orange needle barely change?
You're probably on a time-based chart, where bars form on a fixed clock. Bars per minute only reflects market speed on Renko, Range, Tick or Volume charts.
The green needle is stuck at the top or bottom. What do I change?
Adjust Max Ticks/sec, or drag the slider, to match your instrument's pace.
Can I use the values in my own strategy?
Yes. TicksPerSecond and BarsPerMinute are exposed as series you can read from NinjaScript; see the example above.
How many computers can I use it on?
Each license covers up to 2 computers. Activation takes a few minutes on the Activate page.
Is it included in the bundle?
Yes. The NinjaTrader bundle includes all seven Tradebrary indicators at a discounted price.
Can I get a refund?
Because the indicator is digital and delivered instantly, all sales are final once license keys are issued. Please read the user guide and our Refund Policy before purchasing.
Related indicators
Get the Speedometer
Includes the PDF user guide and direct email support.
By purchasing, you agree to our Terms, License, and Risk Disclaimer. Trading involves risk of loss.