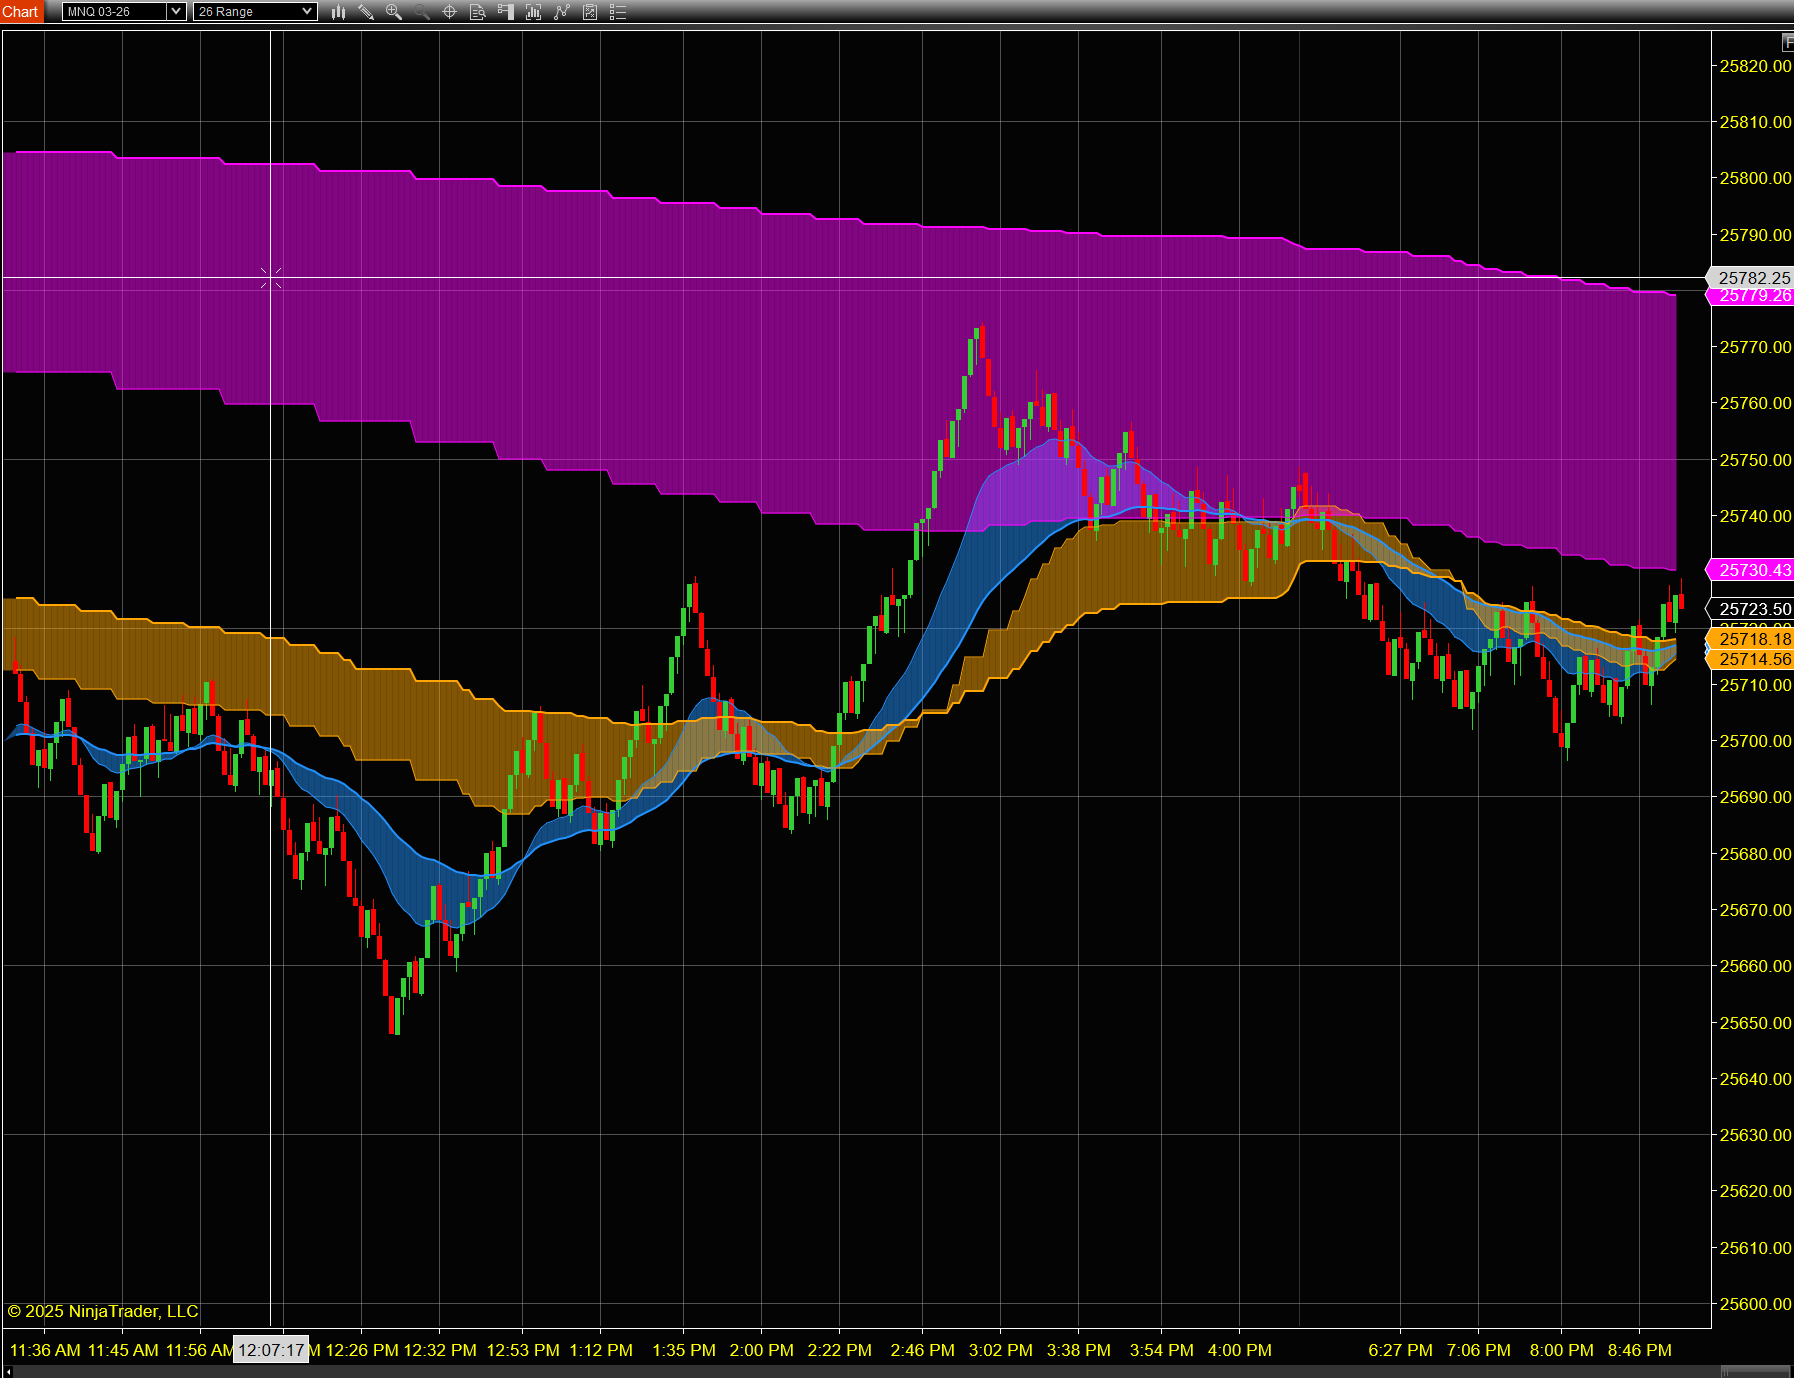
What the 3 Timeframe Trend indicator does
Is the trend on your chart the same trend the bigger timeframes see? This indicator shows you at a glance. It draws a fast and a slow moving average from three timeframes on your chart: your chart's own timeframe plus two higher timeframes you choose. A colored region between each pair forms a ribbon that shows the trend's direction and strength.
- Three moving-average pairs from different timeframes, on one chart.
- Nine moving-average types: DEMA, EMA, HMA, SMA, SuperTrend, TEMA, VWMA, WMA and ZLEMA.
- Bullish and bearish colors for each timeframe, six in all.
- Alignment coloring: color the bars or the background only when every enabled timeframe agrees.
- Optional timeframes: turn the second and third timeframes on or off; disabled ones load no data.
Reading the ribbons
Each timeframe shows its bullish color when its fast moving average is above its slow one, and its bearish color when it's below. The ribbon's width reflects trend strength: a widening ribbon suggests a strengthening trend, and a narrowing one can mean consolidation or a possible turn.
| Timeframe | Source | Bullish | Bearish |
|---|---|---|---|
| TF1 | Your chart's timeframe | Green | Red |
| TF2 | Your choice (default 5-minute) | Royal blue | Orange |
| TF3 | Your choice (default 15-minute) | Cyan | Magenta |
When several timeframes show their bullish color, they agree on an uptrend; all bearish means they agree on a downtrend. Mixed colors mean the timeframes disagree, which is a reason for caution.
Color modes
The Color Target setting chooses how the trend is shown:
| Mode | What it shows |
|---|---|
| Region | Colored ribbons between the fast and slow averages for each timeframe (the default). |
| Bars | Colors the price bars only when all enabled timeframes agree: lime when all are bullish, red when all are bearish. |
| Background | Colors the chart background only when all enabled timeframes agree. |
| Bars and Region | The ribbons, plus bar coloring when all timeframes agree. |
| Background and Region | The ribbons, plus background coloring when all timeframes agree. |
| None | Moving average lines only, with no coloring. |
Nine moving average types
Each timeframe can use its own type:
| Type | Character |
|---|---|
| SMA | Simple average, equal weight to every bar. |
| EMA | Exponential, weights recent prices more. A good default. |
| WMA | Linear weighting, moderate responsiveness. |
| DEMA | Double exponential: faster, with less lag. |
| TEMA | Triple exponential: very fast, can overshoot. |
| HMA | Hull: very smooth, with minimal lag. |
| ZLEMA | Zero-lag EMA: more responsive to price changes. |
| VWMA | Volume-weighted: emphasizes high-volume moves. |
| SuperTrend | ATR-based: adapts to volatility. |
Settings
| Setting | Default | What it does |
|---|---|---|
| TF1 MA Type / Fast / Slow | EMA / 20 / 50 | Moving average type and periods for your chart's timeframe. |
| Enable TF2 / Enable TF3 | On | Turn the second or third timeframe on or off. Disabled timeframes load no data and are left out of alignment coloring. |
| TF2 Type / Value | Minute / 5 | The second timeframe, e.g. 5-minute bars (Minute, Tick, Range and more). |
| TF3 Type / Value | Minute / 15 | The third timeframe, e.g. 15-minute bars. |
| TF2 and TF3 MA Type / Fast / Slow | EMA / 20 / 50 | Moving average type and periods for each higher timeframe. |
| Color Target | Region | How the trend is shown (see Color modes). |
| Region Opacity | 50 | Transparency of the ribbons (0–100%). |
| Use Close vs Fast MA for Color | Off | When on, the color follows the close above or below the fast average, instead of the fast average versus the slow one. |
| All Bullish / All Bearish Color | Lime / Red | Bar or background color when all enabled timeframes agree. |
| Show MA1 / MA2 / MA3 | On | Show or hide each timeframe's moving average lines. |
Suggested timeframe combinations
Set the second and third timeframes higher than your chart. Some starting points from the user guide:
| Style | Chart | TF2 | TF3 |
|---|---|---|---|
| Scalping | 1-minute | 3-minute | 5-minute |
| Day trading | 5-minute | 15-minute | 60-minute |
| Swing trading | 60-minute | 4-hour | Daily |
A common approach: let the higher timeframes set the direction, and use your chart's timeframe for timing.
Installation and activation
- Download the zip above. In NinjaTrader 8, go to Tools → Import → NinjaScript Add-On… and select the indicator's add-on zip. It compiles automatically. The PDF user guide in the download walks through every step.
- Add it to a chart: right-click the chart, choose Indicators… and pick Tradebrary → Tb3TFTrend.
- Order on Whop to receive your Whop license key.
- In NinjaTrader, open Help → About and copy your Machine ID.
- On the Activate page, enter your Whop license key and Machine ID to get your indicator key.
- Paste that key into the indicator's LicenseKey setting and click OK.
Each license covers up to 2 computers. If you reinstall NinjaTrader or switch computers, simply activate again. If you've reached the 2-computer limit, email support@tradebrary.com to free up a slot.
Frequently asked questions
Which moving averages can I use?
Nine types: DEMA, EMA, HMA, SMA, SuperTrend, TEMA, VWMA, WMA and ZLEMA. Each timeframe can use a different type.
Can I use only two timeframes?
Yes. Turn off Enable TF2 or Enable TF3; a disabled timeframe loads no data and is left out of the alignment coloring.
What does alignment coloring mean?
In the Bars and Background modes, color appears only when every enabled timeframe agrees: lime when all are bullish, red when all are bearish, and no color when they're mixed.
Why don't I see any ribbons?
Load enough history for all timeframes: at least as many bars as your slowest average (50 by default). Also check that Color Target isn't set to None.
How many computers can I use it on?
Each license covers up to 2 computers. Activation takes a few minutes on the Activate page.
Is it included in the bundle?
Yes. The NinjaTrader bundle includes all seven Tradebrary indicators at a discounted price.
Can I get a refund?
Because the indicator is digital and delivered instantly, all sales are final once license keys are issued. Please read the user guide and our Refund Policy before purchasing.
Related indicators
Get the 3 Timeframe Trend indicator
Includes the PDF user guide and direct email support.
By purchasing, you agree to our Terms, License, and Risk Disclaimer. Trading involves risk of loss.