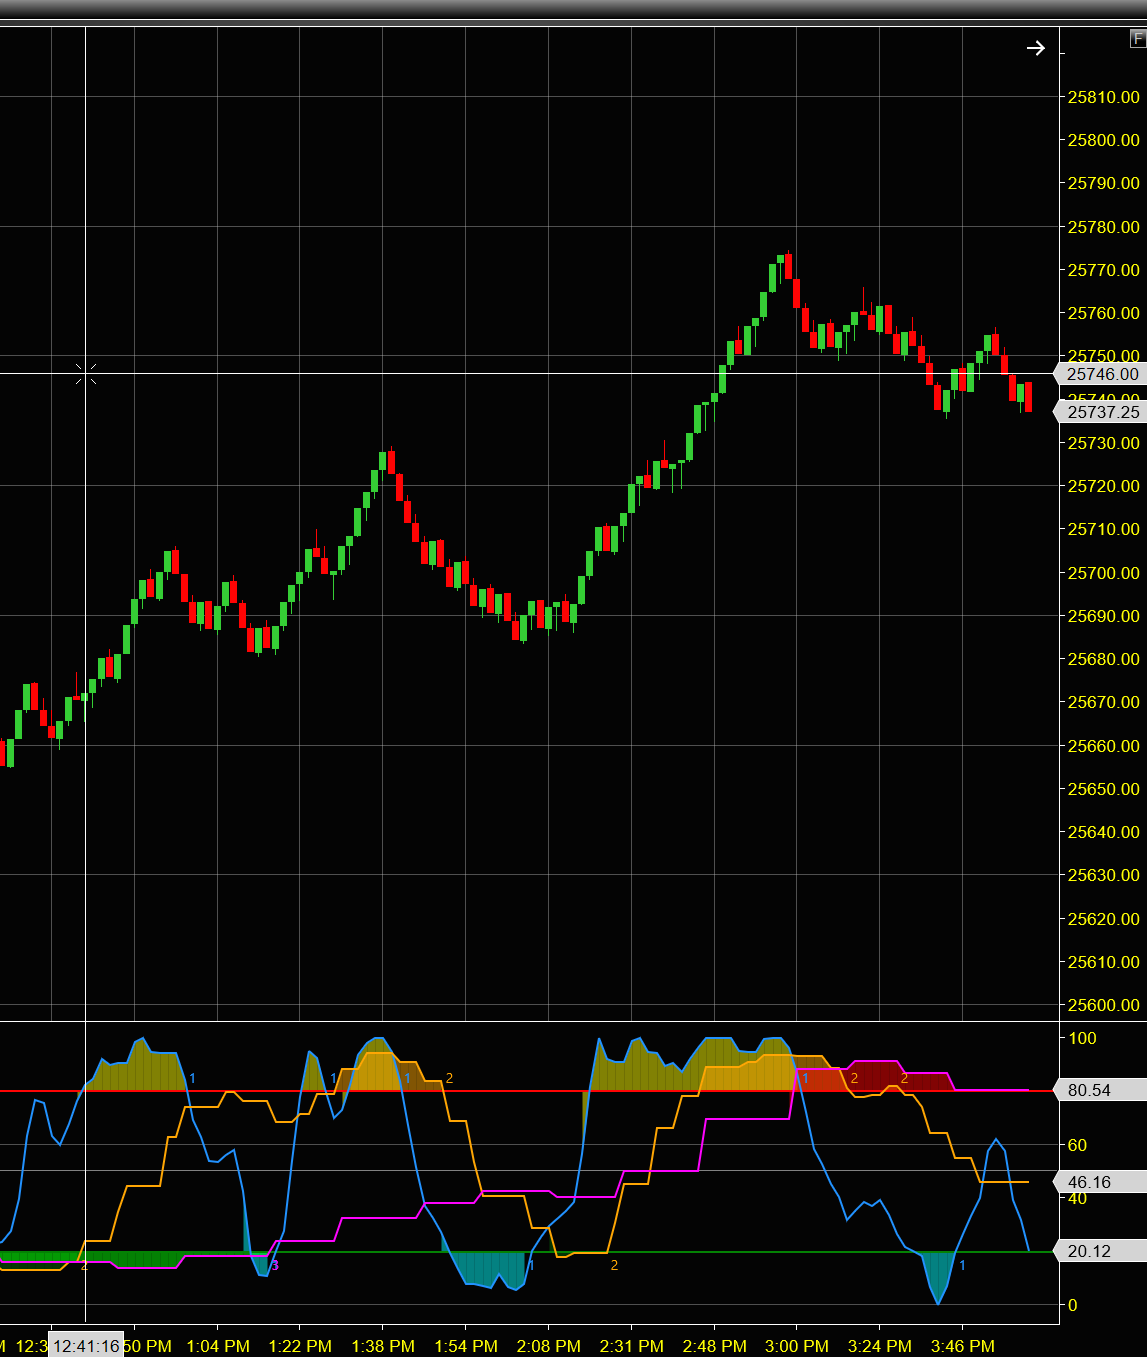
What the 3 Timeframe Stochastics indicator does
Stochastics shows where the close sits within the recent price range, which helps spot markets stretched toward the top or bottom of that range. On its own it covers one timeframe. This indicator shows Stochastics from three timeframes at once in a single panel: your chart's timeframe plus two higher timeframes you choose.
- Three timeframes, one panel: your chart plus two more, 5-minute and 15-minute by default.
- Colored regions when any line enters the overbought or oversold zone, in a separate color for each timeframe.
- Crossover markers: a 1, 2 or 3 on the chart shows which timeframe just crossed an overbought or oversold level.
- Fully customizable: %K, %D, smoothing, timeframes, levels and colors.
Reading the colored regions
The three lines are drawn in dodger blue (your chart), orange (second timeframe) and magenta (third timeframe). When a line moves above the overbought level or below the oversold level, a colored region fills the space between the line and that level:
| Timeframe | Overbought color | Oversold color |
|---|---|---|
| TF1: your chart's timeframe | Yellow | Cyan |
| TF2: second timeframe | Orange | Dark green |
| TF3: third timeframe | Red | Lime |
When several timeframes are shaded at the same extreme at once, they agree. Many traders look for that kind of agreement, together with confirmation from price action, before acting.
Crossover markers
When a Stochastics line crosses the overbought or oversold level, a number appears on the chart in that timeframe's color: 1 for your chart's timeframe, 2 for the second and 3 for the third. Numbers appearing in sequence, such as 1, then 2, then 3, show more timeframes joining the same move.
Ways to use it
- Wait for agreement. The clearest readings come when several timeframes are shaded at the same extreme.
- Use it as a filter. Even if you don't trade Stochastics signals, think twice about longs when several timeframes are overbought, and about shorts when several are oversold.
- Watch which timeframe turns first. One timeframe turning while the others stay at an extreme can be an early sign of a reversal.
- Match the timeframes to your style. Scalpers might use 1, 3 and 5 minutes; day traders 5, 15 and 60 minutes; swing traders 60 minutes, 240 minutes and daily.
Settings
| Setting | Default | What it does |
|---|---|---|
| TF1 Period K / D / Smooth | 14 / 3 / 3 | Stochastics settings for your chart's timeframe. |
| TF2 Type / Value | Minute / 5 | The second timeframe (Minute, Tick, Range and more). |
| TF2 Period K / D / Smooth | 14 / 3 / 3 | Stochastics settings for the second timeframe. |
| TF3 Type / Value | Minute / 15 | The third timeframe. |
| TF3 Period K / D / Smooth | 14 / 3 / 3 | Stochastics settings for the third timeframe. |
| Overbought Level | 80 | Level above which Stochastics counts as overbought. |
| Oversold Level | 20 | Level below which Stochastics counts as oversold. |
| OB1–OB3 / OS1–OS3 Colors | See table above | Overbought and oversold region colors for each timeframe. |
| Background Opacity | 50 | Transparency of the colored regions (0–100%). |
Installation and activation
- Download the zip above. In NinjaTrader 8, go to Tools → Import → NinjaScript Add-On… and select the indicator's add-on zip. It compiles automatically. The PDF user guide in the download walks through every step.
- Add it to a chart: right-click the chart, choose Indicators… and pick Tradebrary → Tb3TFStochastics.
- Order on Whop to receive your Whop license key.
- In NinjaTrader, open Help → About and copy your Machine ID.
- On the Activate page, enter your Whop license key and Machine ID to get your indicator key.
- Paste that key into the indicator's LicenseKey setting and click OK.
Each license covers up to 2 computers. If you reinstall NinjaTrader or switch computers, simply activate again. If you've reached the 2-computer limit, email support@tradebrary.com to free up a slot.
Frequently asked questions
How is it different from the 3 Timeframe RSI?
Both show three timeframes with the same colored regions and markers. Stochastics measures where the close sits within the recent high-low range; RSI measures the strength of recent gains against recent losses. Some traders prefer one, some use both. See the 3 Timeframe RSI.
Which timeframes can I use?
The first line always uses your chart's timeframe. For the second and third you choose a bar type (Minute, Tick, Range and more) and a size. The defaults are 5-minute and 15-minute.
What do the numbers 1, 2 and 3 on the chart mean?
They're crossover markers showing which timeframe's Stochastics just crossed the overbought or oversold level: 1 is your chart's timeframe, 2 the second and 3 the third.
The lines look jumpy. What can I change?
That can happen with very low %K values. Increase Period K or Smooth for steadier lines.
How many computers can I use it on?
Each license covers up to 2 computers. Activation takes a few minutes on the Activate page.
Is it included in the bundle?
Yes. The NinjaTrader bundle includes all seven Tradebrary indicators at a discounted price.
Can I get a refund?
Because the indicator is digital and delivered instantly, all sales are final once license keys are issued. Please read the user guide and our Refund Policy before purchasing.
Related indicators
Get the 3 Timeframe Stochastics indicator
Includes the PDF user guide and direct email support.
By purchasing, you agree to our Terms, License, and Risk Disclaimer. Trading involves risk of loss.