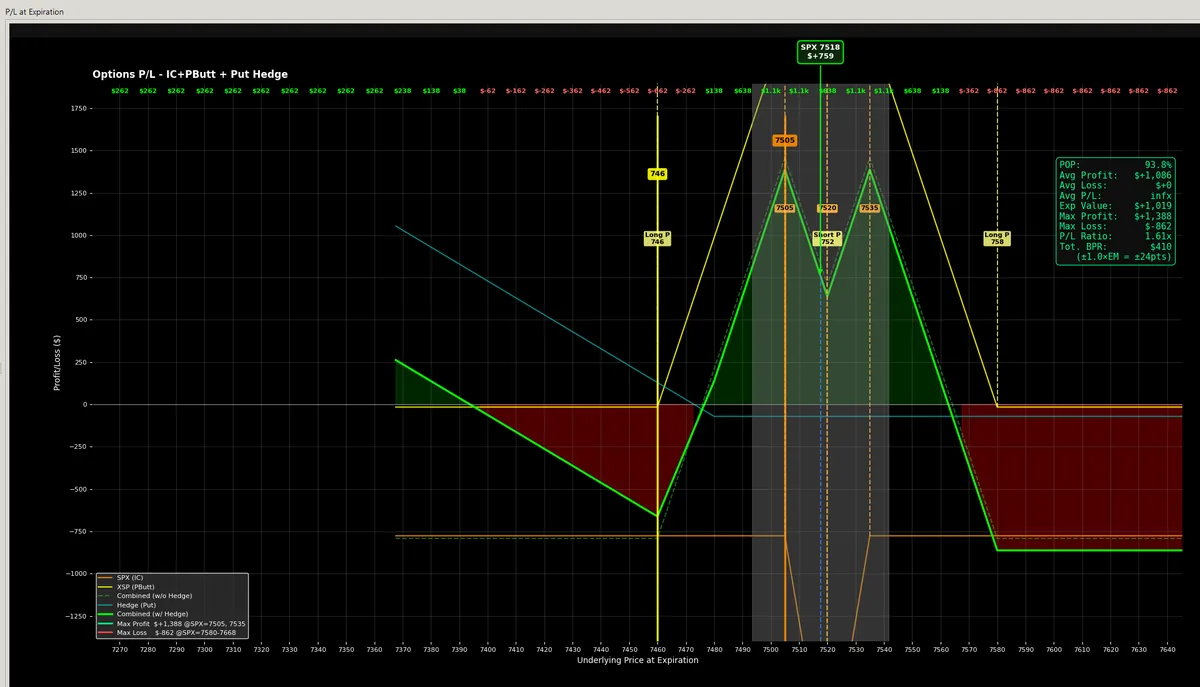
Why hedge SPX options with XSP?
XSP (Mini-SPX) options track the same S&P 500 index as SPX options at one tenth of the size. That makes XSP a natural way to fine-tune an SPX position: you can add a hedge in small increments instead of in full SPX-sized steps. For a full comparison of the two, see SPX vs XSP options.
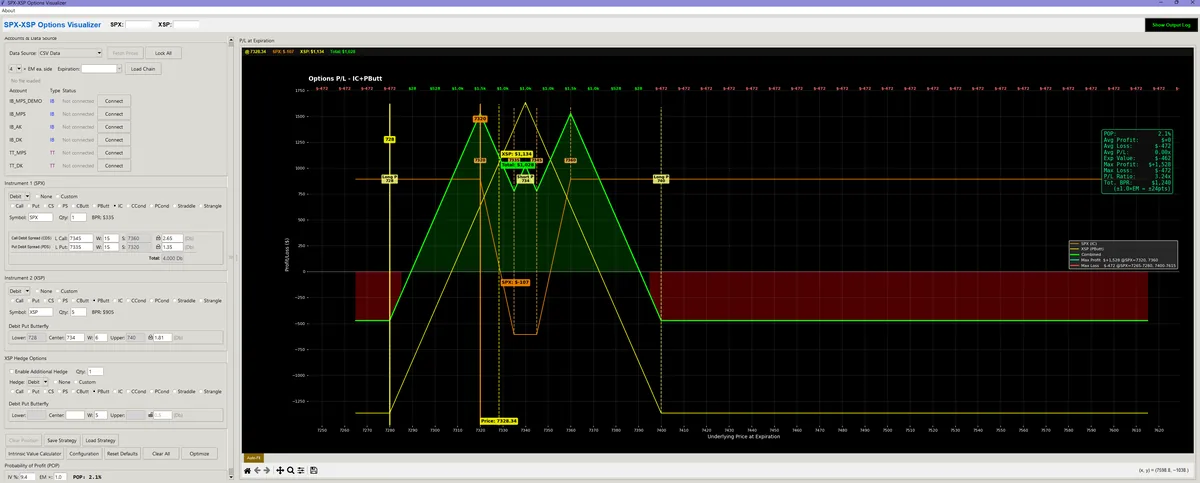
The idea behind the Visualizer is to shape a risk graph you are comfortable holding: an SPX position plus an XSP hedge whose combined profit and loss at expiration you can see before you place the trade. Most options platforms show each position separately. Here both instruments, plus an optional extra hedge, are drawn on one chart, scaled to SPX terms and summed into a single combined curve.
The Visualizer plots P/L at expiration and is designed for positions you plan to hold through to expiration, which also saves the commissions you would pay to close them early.
Just need quick numbers for a single spread? Try our free SPX & XSP options calculator.
What you can do with it
- Plot expiration P/L for multi-leg strategies on SPX and XSP at the same time, with a combined curve for the whole position.
- Add a third position, an optional extra XSP hedge, shown as its own curve and included in the totals.
- Drag strikes on the chart to explore different positions; premiums update automatically.
- See the numbers: probability of profit, expected value, max profit and loss, average profit and loss, and buying power reduction (BPR).
- Use live prices from Tastytrade or Interactive Brokers, or work offline from saved option chain files.
- Optimize strikes, widths and quantities across thousands of combinations.
- Place orders directly with Tastytrade or Interactive Brokers.
- Include costs: commissions and slippage per broker and per instrument are subtracted from the P/L curves.
Supported strategies
Each instrument can hold any of these strategies, as a credit or a debit position, in any quantity:
| Strategy | What it is |
|---|---|
| Call / Put | A single long or short option. |
| Call spread / Put spread | Credit or debit vertical spreads. |
| Iron condor | A call spread plus a put spread, as a credit or debit. |
| Call condor / Put condor | Two call or two put spreads at different strikes. |
| Call butterfly / Put butterfly | A middle strike with two wings. |
| Straddle / Strangle | Long or short, at one strike or two. |
| Double broken-wing butterfly | A call broken-wing butterfly above the center plus a put one below (SPX only). |
| Custom | Up to four legs, each with its own type, strike, ratio and price. |
Reading the risk graph
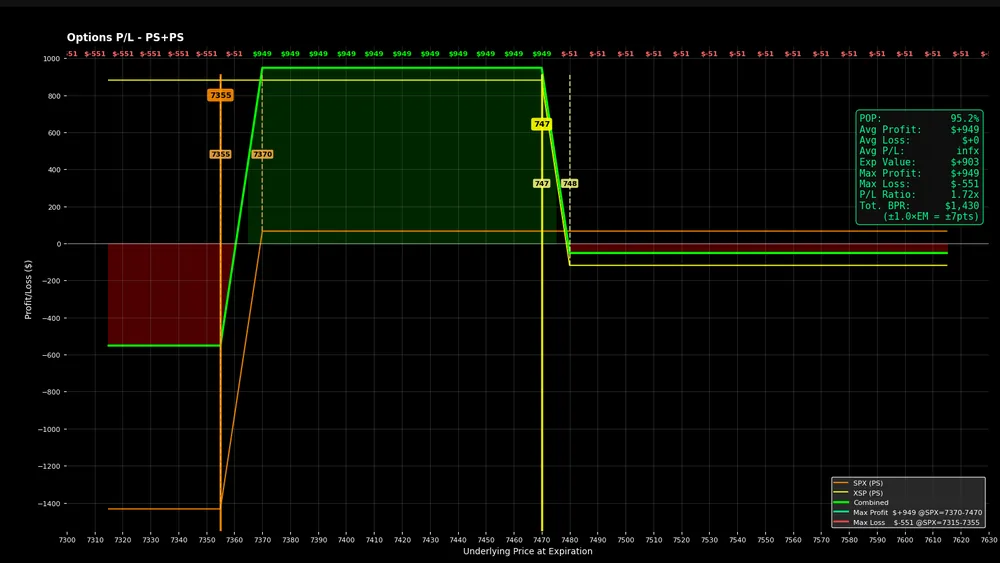
The chart shows profit or loss at expiration (vertical axis) for every SPX price (horizontal axis). Each active position has its own colored curve, and the green curve is the combined position. A grey band marks the expected move, calculated from implied volatility and days to expiration, and vertical lines mark each strike. Drag the solid line to move a whole combo, or a dashed line to move a single leg.
Next to the chart, a statistics box shows:
- POP: the probability that the combined position finishes with a profit, from a log-normal price model using implied volatility.
- Expected value: the probability-weighted average P/L at expiration.
- Max profit and max loss within the chart's price range.
- Average profit, average loss and their ratio.
POP, expected value and buying power are estimates from a model. Actual results can differ, and no figure shown by the software is a guarantee.
Strategy optimizer
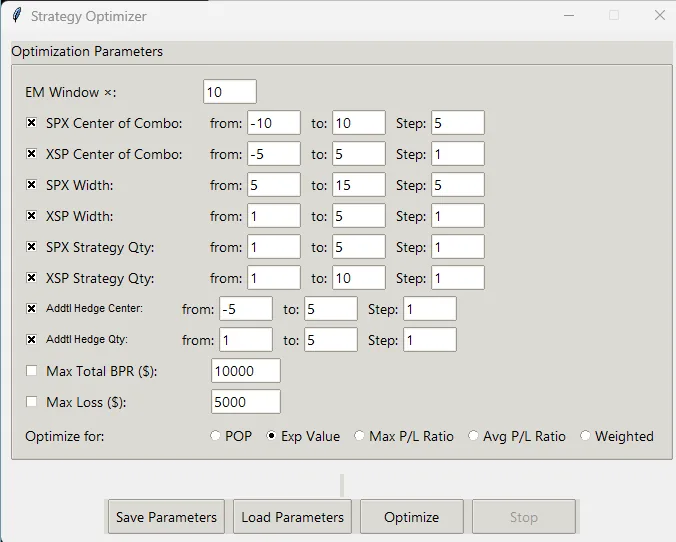
The optimizer tests combinations of strike positions, spread widths and quantities for every instrument and keeps the one that best fits the target you choose: probability of profit, expected value, max profit-to-loss ratio, average profit-to-loss ratio, or a weighted mix of all four.
- Skip combinations above a maximum total buying power or a maximum loss you set.
- Keep every strike inside the expected-move window.
- Stop at any time; the best result so far is applied.
- Every run is saved as a CSV file you can open in Excel.
Live data from Tastytrade or Interactive Brokers
Connect a Tastytrade account (through a personal OAuth client) or Interactive Brokers (through TWS or IB Gateway) to load option chains and stream live bid/ask prices into every leg as the market moves. Lock any price to model a fill that differs from the mid. You can also save a chain to a CSV file and work offline later, or type premiums in by hand, so a broker connection is optional.
Examples
Two of the strategy examples from the user guide. They illustrate what the Visualizer can show; they are not trade recommendations.
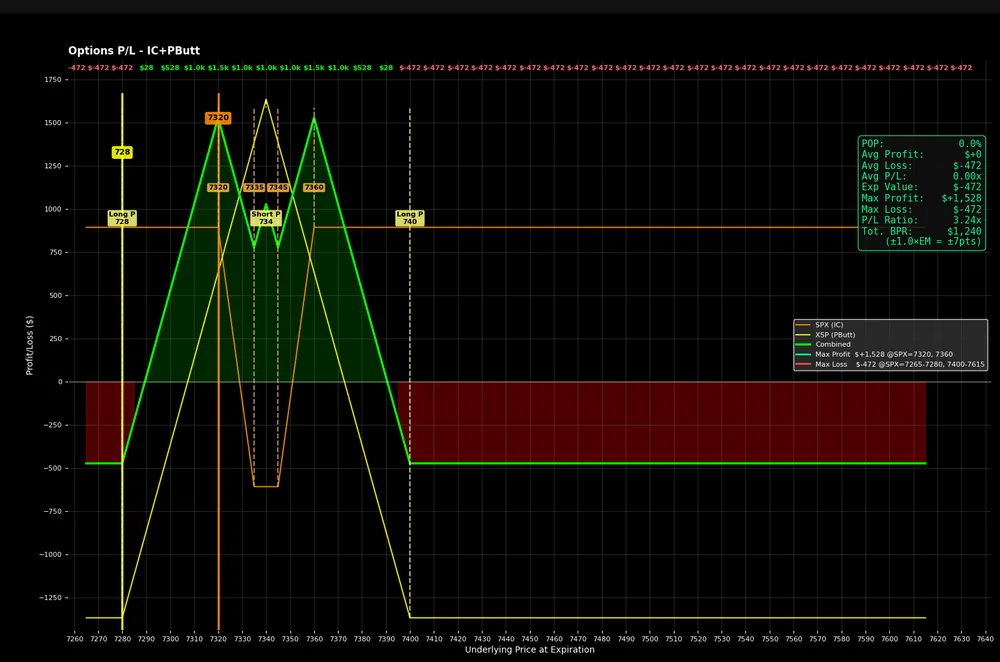
Mountain Range
A debit iron condor on SPX combined with a debit put butterfly on XSP. The butterfly adds a central profit peak on top of the condor's wide profit zone.
Hedged Put Spread
A put credit spread on SPX paired with a put debit spread on XSP. The XSP hedge offsets part of the downside loss while keeping most of the credit.
System requirements
| Component | Minimum | Recommended |
|---|---|---|
| Operating system | Windows 10 (64-bit) | Windows 11 (64-bit) |
| Memory | 4 GB RAM | 8 GB RAM |
| Disk space | About 250 MB | About 250 MB |
| Display | 1600 × 900 | 1920 × 1080 |
| Internet | For activation and live broker data | |
Getting started
- Get the Visualizer on Whop. Your license key appears on your Whop membership page.
- Open the download page, click the green Code button and choose Download ZIP.
- Extract the ZIP and run the installer. If Windows shows a SmartScreen notice for new software, click More info → Run anyway.
- On first launch, paste your license key and click Activate.
- Follow the Quick Start guide in the download to set up your first strategy.
One license key works on up to 2 computers you own, such as a desktop and a laptop. To move to a new computer, deactivate the old one from the app's About menu. The full user guide (PDF) covers every feature.
Frequently asked questions
What is the difference between SPX and XSP options?
Both are options on the S&P 500 index. XSP (Mini-SPX) is one tenth the size of SPX, so it lets you size a position or a hedge in much smaller steps. The Visualizer scales XSP to SPX terms so both appear on the same chart.
Do I need a broker account?
No. You can load option chain CSV files or type premiums in by hand. Connecting Tastytrade or Interactive Brokers adds live prices, chain downloads and order entry.
Can it place orders?
Yes. When a Tastytrade or Interactive Brokers account is connected, you can submit the position as an order from the app.
Does it run on a Mac?
No. It's a Windows 10/11 (64-bit) desktop application.
Is the probability of profit a guarantee?
No. POP and expected value are estimates based on implied volatility and a log-normal price model. Real outcomes can differ, so treat them as one input to your own decision.
How many computers can I use it on?
Each license key activates on up to 2 computers you own. The key is checked when the app starts, with a short grace period if your internet is temporarily down.
Can I get a refund?
Because the software is digital and delivered instantly, all sales are final once a license key is issued. Please read the user guide and our Refund Policy before purchasing.
Get the SPX-XSP Risk Graph Visualizer
Includes the installer, a quick start guide, the full user guide and direct email support.
By purchasing, you agree to our Terms, License, and Risk Disclaimer. Trading options involves substantial risk of loss.