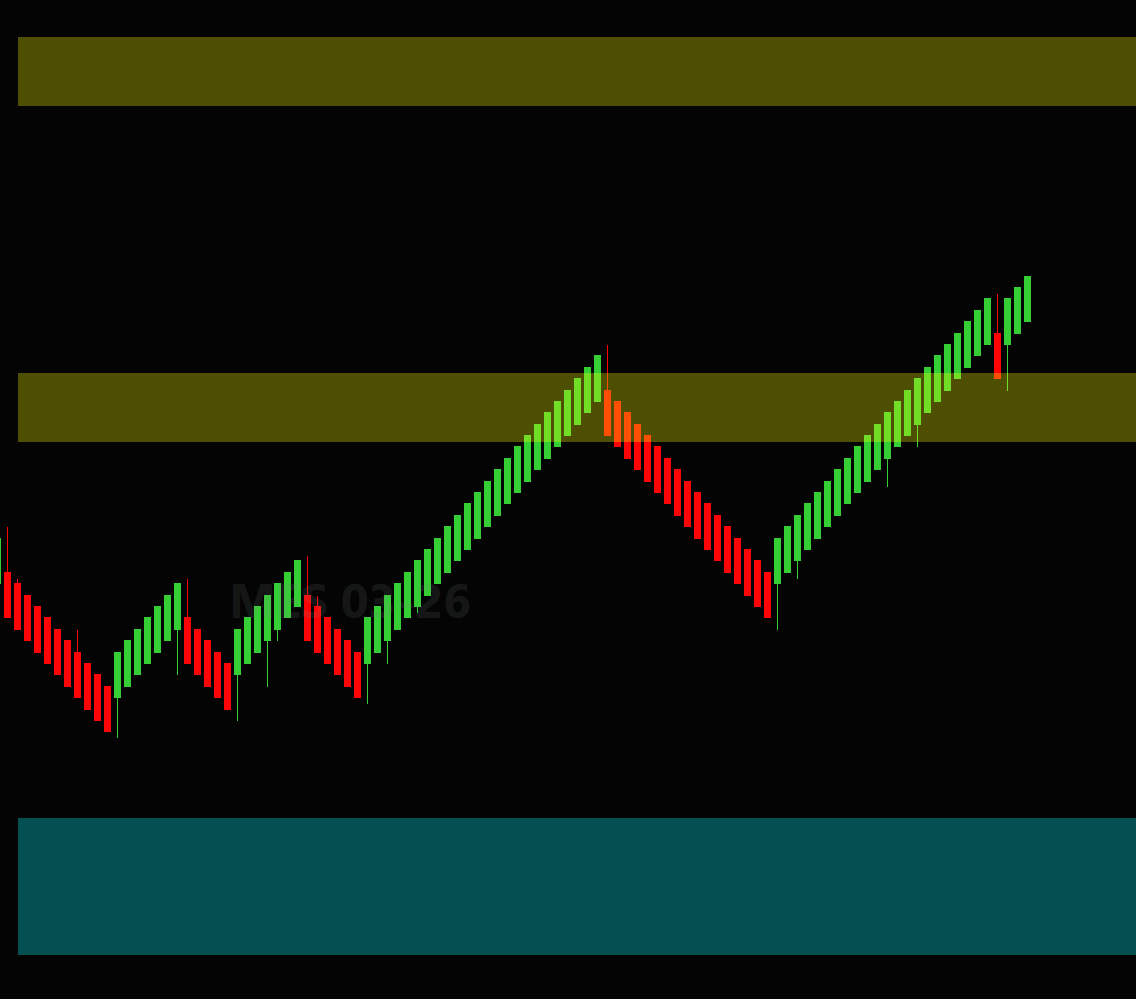
What the Secondary Timeframe indicator does
The levels that matter most often come from a bigger timeframe than the one you trade. This indicator finds significant price swings on a higher (secondary) timeframe that you choose, then draws those support and resistance levels right on your current chart. Swing lows become support (green) and swing highs become resistance (red), drawn as clean lines or shaded zones.
Trade a 1- or 3-minute chart while seeing the 15- or 30-minute levels, with no second chart to open and keep in sync.
- Any secondary timeframe: minute, tick, range, volume, day and more.
- Works on fast charts: a 30-minute level shows as a single line or zone even on a 1-minute or Renko chart.
- You decide what counts as significant with the Swing Strength setting.
- Lines or zones, with your choice of colors.
- Strategy-ready: a built-in signal you can use in your own NinjaScript strategies.
Prefer levels from your chart's own timeframe? The Support & Resistance indicator works the same way on the chart timeframe. Running both together shows local and higher-timeframe levels at once.
How it works
Instead of reading your chart's bars, the indicator loads a second, higher-timeframe data series in the background and scans those bars for swing pivots:
- Support is a swing low on the secondary timeframe: a bar whose low is lower than the bars on either side.
- Resistance is a swing high on the secondary timeframe: a bar whose high is higher than the bars on either side.
The levels are drawn on your current chart and extended to the right edge. Swing Strength sets how many bars must be higher or lower on each side of a pivot, counted in secondary-timeframe bars; larger values give fewer, more significant levels. Max Levels caps how many support and resistance levels are shown.
Because the levels come from the higher timeframe, they update only when each higher-timeframe bar completes. On a 1-minute chart with 30-minute levels, expect them to change in steps, not on every bar.
Choosing the secondary timeframe
Two settings in the Data Series group control which timeframe the levels come from:
- Secondary Timeframe Type: the kind of bars to build (Minute, Tick, Range, Volume, Day and so on).
- Secondary Timeframe Value: the size that goes with the type. For example, Minute + 15 gives 15-minute levels, Tick + 1000 gives 1000-tick levels, and Range + 10 gives 10-tick range levels.
Pick a timeframe larger than the chart you're viewing, such as 15-minute levels on a 1- or 3-minute chart. That's the whole point: bringing bigger-picture levels down onto a faster chart. Make sure enough history is loaded for the higher timeframe to form swings.
Lines or shaded zones
Lines mode draws a single horizontal line at each level, with your choice of thickness and style. Zones mode draws a shaded band a set number of ticks above and below each level. Higher-timeframe levels work best as reaction areas rather than exact prices, so zones with a few ticks of height suit this indicator well.
Settings
| Setting | Default | What it does |
|---|---|---|
| Secondary Timeframe Type | Minute | The bar type used to calculate the levels (Minute, Tick, Range, Volume, Day, etc.). |
| Secondary Timeframe Value | 5 | The size for that type, e.g. 5 for 5-minute or 100 for 100-tick. Choose a higher timeframe than your chart. |
| Swing Strength | 5 | Bars required on each side of a pivot to confirm a swing (1–20), counted on the secondary timeframe. |
| Max Levels | 3 | Maximum number of support and of resistance levels shown (1–10). |
| ATR Period | 14 | ATR period for the built-in proximity signal (see "For strategy developers"). |
| Display Mode | Lines | Draw levels as Lines or shaded Zones. |
| Support / Resistance Color | Green / Red | Colors of the support and resistance levels. |
| Line Thickness | 2 | Line width in Lines mode (1–5). |
| Line Style | Solid | Line pattern in Lines mode (solid, dash, dot, etc.). |
| Zone Height (Ticks) | 4 | How many ticks each zone extends above and below the level (1–50). |
| Zone Opacity % | 20 | Transparency of the zones in Zones mode (1–100). |
Tips for using it
- Stack two timeframes. Set a higher timeframe here (e.g. 30-minute) and add the chart-timeframe Support & Resistance indicator in different colors to see major and local levels together.
- Use zones for higher-timeframe areas. A few ticks of zone height reflects that these levels are reaction areas, not exact prices.
- Load enough history. A 30-minute secondary timeframe needs many days of data to form swings. If levels are missing, increase the chart's "Days to load".
For strategy developers
The indicator exposes a Condition series you can reference from your own NinjaScript strategies. It flags when price comes within about half an ATR of the nearest level: 1 near support (bullish), -1 near resistance (bearish) and 0 otherwise.
Installation and activation
- Download the zip above. In NinjaTrader 8, go to Tools → Import → NinjaScript Add-On… and select the indicator's add-on zip. It compiles automatically. The PDF user guide in the download walks through every step.
- Add it to a chart: right-click the chart, choose Indicators… and pick TbSupportResistanceSecTF.
- Order on Whop to receive your Whop license key.
- In NinjaTrader, open Help → About and copy your Machine ID.
- On the Activate page, enter your Whop license key and Machine ID to get your indicator key.
- Paste that key into the indicator's LicenseKey setting and click OK.
Each license covers up to 2 computers. If you reinstall NinjaTrader or switch computers, simply activate again. If you've reached the 2-computer limit, email support@tradebrary.com to free up a slot.
Frequently asked questions
Why do the levels update in steps?
That's expected. The levels come from the higher timeframe, so they only change when a secondary-timeframe bar completes.
Why don't I see any levels?
Check that Secondary Timeframe Type and Value are set, and load more history so the higher timeframe has enough bars: at least a couple of times the Swing Strength. Also check that your license key is entered.
Can I use it on Renko or tick charts?
Yes. The levels are calculated from the secondary timeframe you choose and drawn on whatever price chart you're viewing, so a 30-minute level appears as a single line or zone even on a Renko or 1-minute chart.
How is it different from the regular Support & Resistance indicator?
The regular version finds swings on your chart's own timeframe. This one finds them on a higher timeframe you choose. Many traders run both on the same chart.
How many computers can I use it on?
Each license covers up to 2 computers. Activation takes a few minutes on the Activate page.
Can I get a refund?
Because the indicator is digital and delivered instantly, all sales are final once license keys are issued. Please read the user guide and our Refund Policy before purchasing.
Related indicators
Get higher-timeframe support & resistance
Includes the PDF user guide and direct email support.
By purchasing, you agree to our Terms, License, and Risk Disclaimer. Trading involves risk of loss.